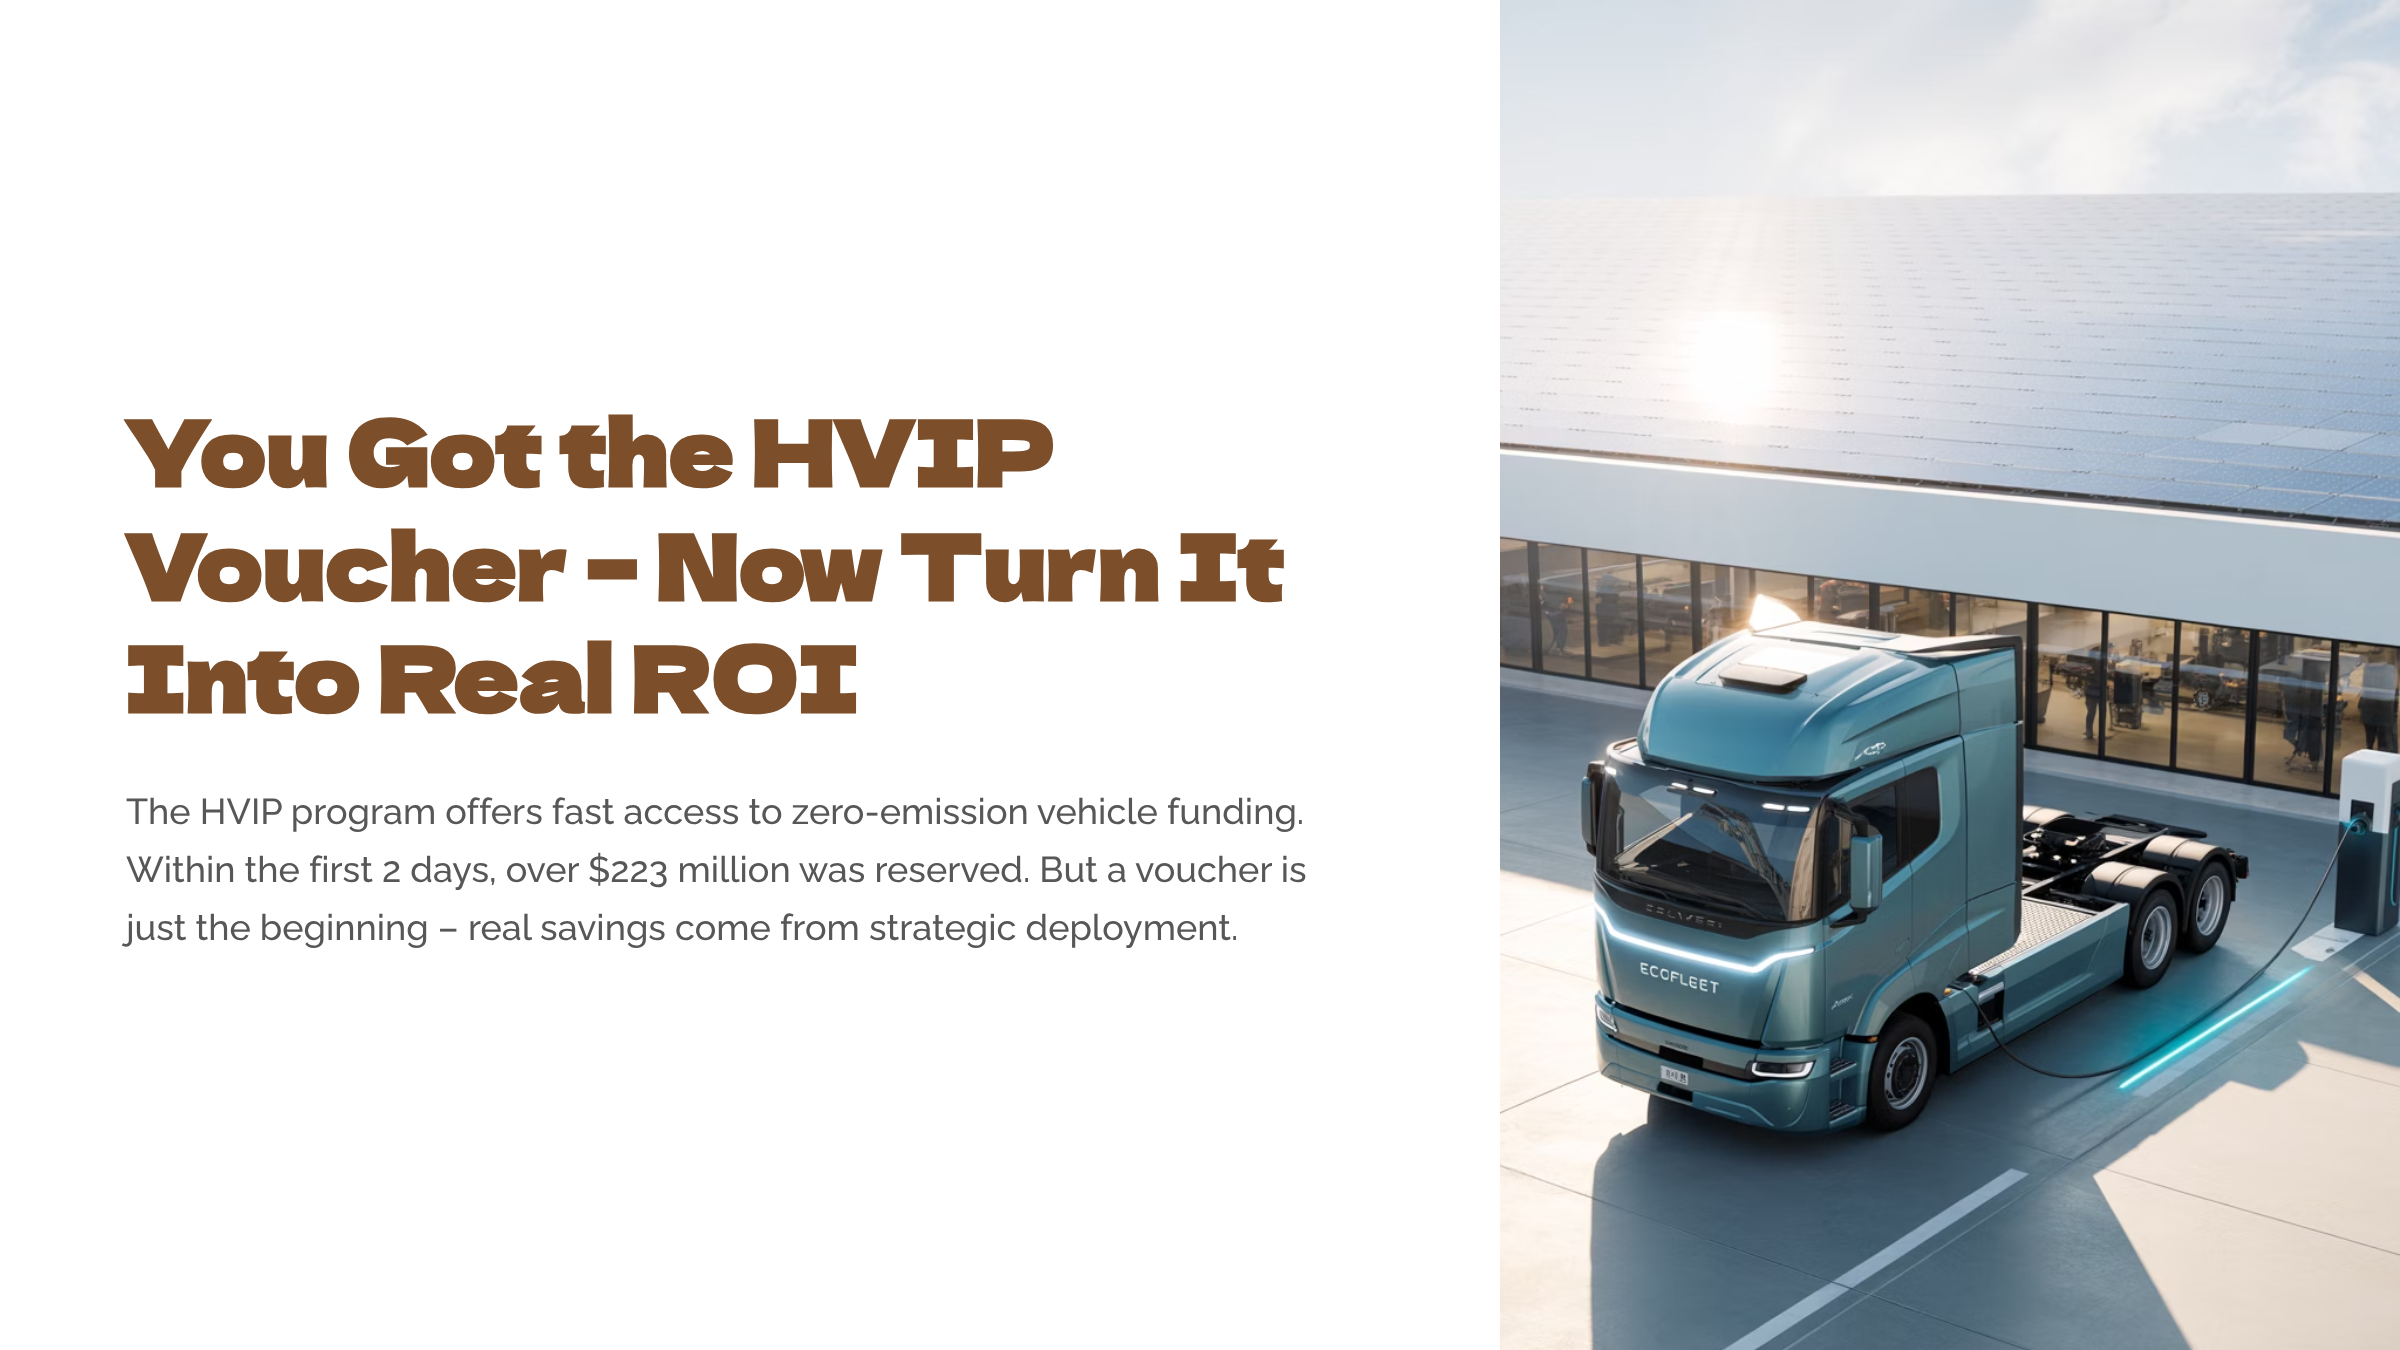
Transitioning to an electric fleet can lead to substantial cost reduction. EVs typically incur lower fuel and maintenance expenses when compared to ICE vehicles. According to McKinsey, battery electric vehicles (BEVs) are projected to outperform ICE vehicles in total cost of ownership (TCO) across all vehicle classes by as soon as 2025.
However, achieving significant emission reductions is a complex task. Coordination of components such as technology, infrastructure, and policy are needed. This complexity often poses challenges for stakeholders who need to navigate these interconnected elements effectively.
Leke Services offers a standardized approach to help stakeholders navigate these interconnected elements effectively. This includes assessing key financial indicators such as capital expenses (CAPEX), operational expenses (OPEX), and the total cost of ownership (TCO). In this context, CAPEX refers to the initial investment for acquiring or building assets like vehicles and infrastructure. OPEX includes ongoing costs for maintenance, repairs, insurance, and charging. TCO represents the total lifecycle cost of an asset, combining both CAPEX and OPEX.
To achieve a more thorough grasp of cost sensitivities, we created over forty archetypes of fleets. Our analysis assumes a 15-year operational period and a one-year fleet technology upgrade phase. We examine how various fleet types, vehicle categories, and daily travel distances influence CAPEX, OPEX, and TCO. The archetypes were created using the following assumptions:
1. Fleet Sizes: 500, 100, 50, and 10 vehicles
2. Vehicle Classes: Light, medium, and heavy-duty vehicles
3. Daily Mileage: 50 or 300 miles
CAPEX is driven primarily by vehicle class
Understanding the financial dynamics of fleet management is crucial for making informed decisions. Considering an HVAC truck fleet of 50 vehicles, for example, our analysis reveals that increasing the fleet size to 100 can raise CAPEX by up to88%, highlighting a significant cost consideration. Additionally, opting for higher vehicle classes can increase CAPEX, with each vehicle class level doubling the expenses. This underscores the importance of strategic vehicle choice.

Expect your OPEX to increase as your CAPEX goes up
Mileage offers flexibility, as it does not significantly affect costs, allowing for varied vehicle usage without financial concern. However, CAPEX is crucial in shaping OPEX. For instance, a$1,000 investment in OPEX can lead to a $120 increase in OPEX, highlighting the need for strategic planning and investment in fleet assets.
Upgrading vehicle classes alone has a minimal impact on OPEX, meaning higher classes don't necessarily lead to increased operational costs. Similarly, adding more vehicles to a fleet shows limited influence on OPEX, indicating that expansion alone won't significantly raise operational expenses.

TCO goes down the more you drive but goes up by vehicle class
For fleet managers aiming to optimize costs, it's essential to understand the factors that influence total cost of ownership (TCO). Although fleet size is correlated to TCO, it is not the key driver as one may assume. On the other hand, higher mileage can significantly reduce TCO. For example, TCO for a fleet of 10 vehicles can go from $0.7 permille down to $0.2 per mile by increasing the daily usage from 50 to 300 miles.
Upgrading vehicle classes can increase costs by $0.27 per mile. This insight highlights the importance of carefully evaluating vehicle class upgrades to ensure they align with budgetary constraints and operational needs.

Conclusion
Transitioning to an electric vehicle (EV) fleet can lower costs and reduce emissions. Fleet managers should strategically consider influencing factors and use tax credits and subsidies, which can cover up to 30% of vehicle expenses, to improve financial outcomes. A solid electrification strategy can achieve emissions goals and enhance financial performance. While this analysis covers fleet size, vehicle class, and mileage impacts, real-world conditions may differ, especially with uncertain insurance costs in the emerging EV market.
Fleet archetype costs were calculated using Brightmerge


